 Mobile device
Information
English (United States)
Description
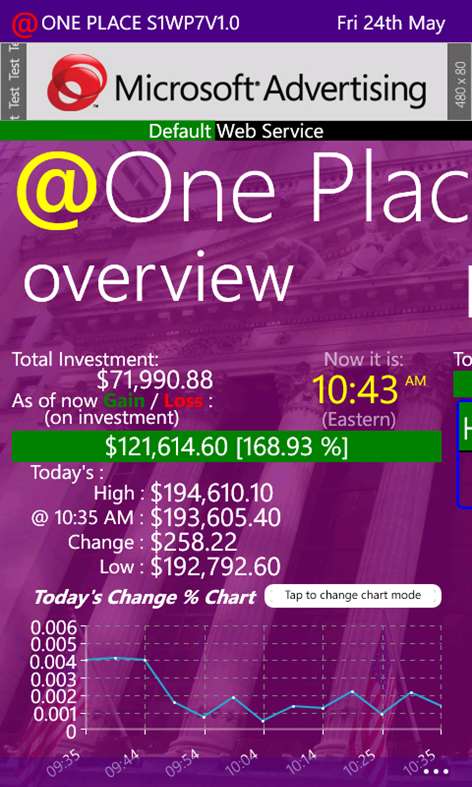
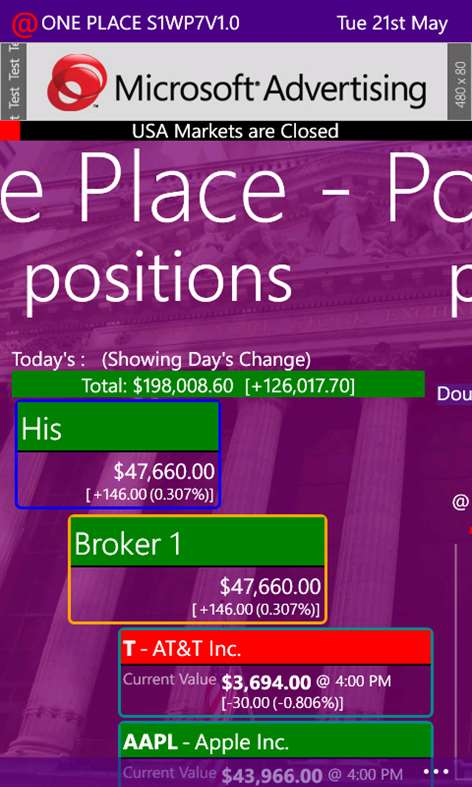
This app consolidates all your portfolios & helps monitor all of them @OnePlace. The emphasis is on the monitoring of the performance of your investment and not on the market analysis. This app is meant for small and long term investors & deals only with stocks traded by USA Stock Exchanges and the tickers are NOT in real time. THIS IS NOT A TOOL FOR AGGRESSIVE INVESTING. In Overview, you can see how your portfolios performing in terms of Today’s Change %, Gain / Loss %, or Total Value. Also you can see how it was performing from start of current year. In Positions, you can see how each of the portfolio, broker or the script that you invested in is positioned. In Market Watch, you can track the symbols that are of interest to you. You can also watch them combined with the scripts that you invested in together how they are all currently performing. In Performance, you can see how the Day’s High & Lows were changing for a selected portfolio, broker or invested script in ‘positions’ or for a selected symbol in ‘market watch’. This app collects data only when it is run. No background data collection is provided at this time. Hence the graphs may not look same on two different devices. The x-axis is not a time axis. Only 3 portfolios are allowed to be tracked. Each portfolio can have multiple brokers attached. You can also set the stocks traded by each of the brokers in a given portfolio. A sample set of portfolios, brokers and stocks is provided. This sample data is completely random. Get hang of the app using this set. Then to enter your own portfolios, after deleting these. If you get Ticker Down message send a support email. I will inform you when it is back. IF YOU KNOW A BETTER DATA SERVICE (FREE OR PAID), PLEASE SEND ME THE DETAILS. ANYONE HAVING STOCKS DATA SERVICE, IF YOU LIKE THIS INTERFACE, I CAN MAKE IT WORK FOR YOUR SERVICE. If you like this app tell others. If you don’t like it tell me why.


